


The Value Of Lab Data Automation To Facilitate Data-Centric Research
Contributed Commentary by Robert D Brown, Ph.D
June 30, 2021 | In recent years, scientific research has moved from being process-driven to data-driven. Scientists are inferring the results of experiments by analyzing more data than ever, and it’s clear that companies that own the cleanest, best-annotated data will be the most successful in making ground-breaking discoveries within this paradigm.
That said there are still significant challenges to data-driven research in as much as it is:
- Time consuming: It is estimated that a typical scientist could spend up to 90 minutes a week on mundane data processing tasks. In certain functions, such as an analytical lab, it could consume as much as 80% of their time.
- Inefficient: Exchanging data with CROs can be equally problematic. While data is still sent in spreadsheets and PDF reports via email or SharePoint, manual curation at one end and manual data extraction at the other creates similar inefficiencies and opportunity for transcription error.
- Unreliable: As AI/ML models become an increasingly important part of decision making, data errors make models unreliable, contributing to a reproducibility crisis. One recent report suggested that 50% of deep learning experiments in pharma were not reproducible, and of those, 25% were attributed to data integrity.
To solve these problems, it is necessary to automate the entire end-to-end data journey (see Figure 1) from its source, whether that be in-house lab instruments or CROs, to its destination (typically informatics, ELN and decision support systems) to greatly increase efficiency and ensure data integrity.
There are benefits of introducing lab data automation capabilities through the entire workflow.
File Acquisition, Storage, Parsing
Many labs today still gather data manually. Worst case, a scientist is collecting files from lab PCs with USB sticks, or, slightly better, browsing networks to the instrument PCs to find the data, but then manually processing and uploading it. So first, we need to automate the acquisition data from the instruments, and then parse, validate and standardize it.
Automation typically functions by:
- Performing a file-sweep to gather up new and modified instrument output files by connecting to the instrument PC. This agent must be intelligent enough to understand instrument run characteristics based on the file output;
- Connecting via API to instruments that connect to their own software platform; or
- For instruments lacking any network connectivity, employ hardware IoT devices to create a basic connection.
The files are then encrypted and uploaded to a cloud application where they are stored in a secure data vault implemented on a data lake. Parsers are then used to extract the data and meta-data from those typically proprietary files into a standard format, and processes can be applied to QC the data. When such as system is used alone, data can be presented in dashboards and lightweight cloud apps to provide scientific and operational insights into the equipment and data.
The value of data automation has been demonstrated at a large pharma mass spec core facility. On implementation, data collection was sped up by 63 times and automation of previous manual processing saved two-thirds of scientists’ time. In addition, automated QC of data along with operational dashboards allowed instrument drift to be detected and corrected in time to prevent needing to repeat experiments.
Automated Experiment Creation, Analysis
Next in the process shown in Figure 1 is the automated creation of experiments, upload of the instrument data into those experiments and automated analysis. This can again replace mundane and error prone human processes.
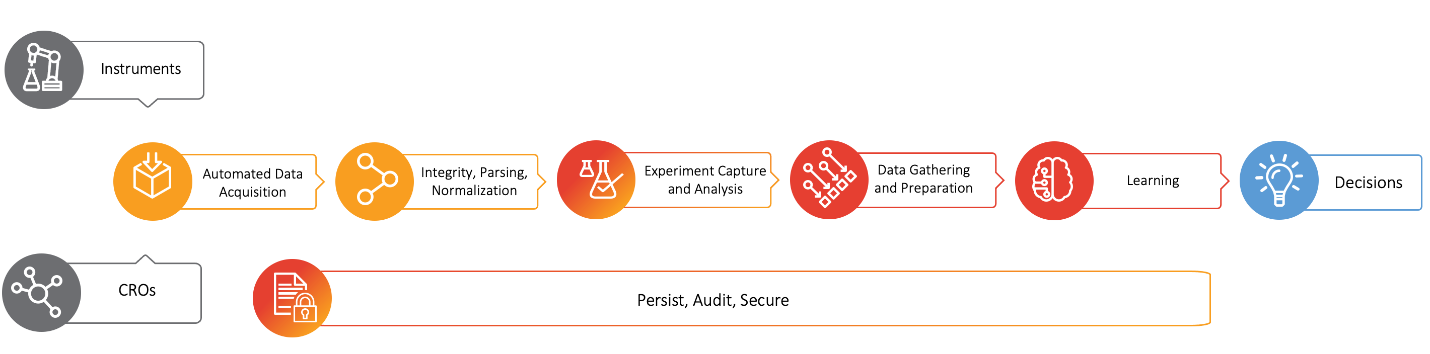
Figure 1: Automated data flow from instruments or CROs to decisions
As an example, consider assay data analysis. In this case, plate readers output raw data files onto a connected PC. In the “traditional” process a scientist would collect those files and manually create a new experiment in assay data management software. They would then upload their files and samples and calculate results before validating and publishing the results to colleagues.
This manual process is unsustainable, particularly for high throughput labs, as the number of experiments that can be done typically greatly exceeds the capacity of the scientists in the lab to analyze them.
With an automated system, the entire manual process can be replaced. Following capture and parsing of files in the data lake, APIs trigger the creation of the experiment in the assay informatics system, followed by automated curve fits and initial curve classifications. The scientist only needs to perform the final validation prior to publishing results, allowing them to manage the huge volume of experiments possible in today’s high throughput screening labs.
Automated Learning
As a final step in the workflow shown in Figure 1 we can add automated learning. An example from bioprocessor monitoring nicely illustrates the value of combining data automation and learning. A legacy manual process at a large pharma required scientists to gather up bioreactor sensor data from the data historian and manually input it into spreadsheets for decisions about the particular run. This process was inefficient and could well take a couple of days to complete
Bioreactors can suffer from dissolved oxygen (DO) crashes with consequences ranging from higher cell death, lower yield or high impurities in the products to the worst case of the loss of the entire high value contents of the reactor. Beyond its inefficiency, the fundamental problem with the manual data process was that these crashes were not predictable: given the slow speed of data gathering and processing, it simply wasn’t possible to learn anything about the run-in time to affect the outcome.
Data automation is now used to automatically collect and store sensor data as it comes off the reactor. The system then applies an ML model to that data in real-time to predict the likelihood of a crash. The model has been trained using sensor data from previous successful and unsuccessful runs, using variables such as the O2 and CO2 flow rates, agitation etc. The results are shown in Figure 2 for a run where a crash does occur. On the charts, time is on the X-axis over an 8-hour time period. On the lower graph the Y axis shows the dissolved oxygen sensor data, with a healthy range until 1:15AM when the DO level drops as the reactor crashes.
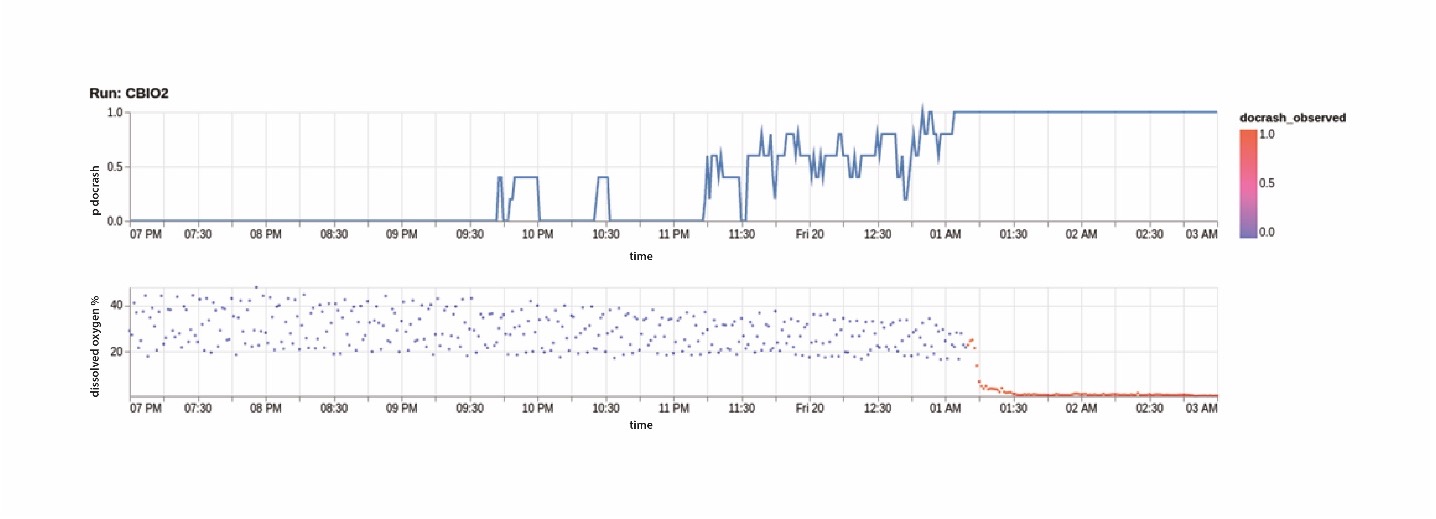
Figure 2: Bioreactor monitoring - DO2 level (bottom) and crash probability (top) vs time
On the top chart is the model prediction, with Y-axis the likelihood (from 0-1) that a crash is going to happen. Using the model, the system could give the operator an alert between 11.30 and midnight, as the model score passes 0.5, giving them time to take corrective action to stabilize or shutdown the reactor before it crashes.
The application of data and workflow automation can add value at every step in the process shown in Figure 1. Data automation ensures that process efficiency and data integrity don’t suffer because data handling and processing are not optimized. The most fundamental thing that the technology achieves is to free up highly experienced, valuable scientists from manual data processing. Instead, they can focus on analysis and decision making that drive projects forward, and they will have the best, cleanest data to do so.
Robert Brown is Vice President for Product Marketing at Dotmatics. Since joining the company in 2015 he has built Product Marketing and Product Management teams with a focus on customer-led product development. With over 20 years of experience in the scientific informatics industry, Robert is ideally positioned to identify key industry trends that will help R&D groups on their informatics journey to the Lab of the Future. He can be reached at rob.brown@dotmatics.com